EXECUTIVE SUMMARY

The Sea Level Rise and Coastal Flood Hazard Scenarios and Tools Interagency Task Force, jointly convened by the U.S. Global Change Research Program (USGCRP) and the National Ocean Council (NOC), began its work in August 2015. The Task Force has focused its efforts on three primary tasks: 1) updating scenarios of global mean sea level (GMSL) rise, 2) integrating the global scenarios with regional factors contributing to sea level change for the entire U.S. coastline, and 3) incorporating these regionally appropriate scenarios within coastal risk management tools and capabilities deployed by individual agencies in support of the needs of specific stakeholder groups and user communities.
This technical report focuses on the first two of these tasks and reports on the production of gridded relative sea level (RSL, which includes both ocean-level change and vertical land motion) projections for the United States associated with an updated set of GMSL scenarios. In addition to supporting the longer-term Task Force effort, this new product will be an important input into the USGCRP Sustained Assessment process and upcoming Fourth National Climate Assessment (NCA4) due in 2018. This report also serves as a key technical input into the in-progress USGCRP Climate Science Special Report (CSSR). In order to bound the set of GMSL rise scenarios for year 2100, we assessed the most up-to-date scientific literature on scientifically supported upper-end GMSL projections, including recent observational and modeling literature related to the potential for rapid ice melt in Greenland and Antarctica. The projections and results presented in several peer-reviewed publications provide evidence to support a physically plausible GMSL rise in the range of 2.0 meters (m) to 2.7 m, and recent results regarding Antarctic ice-sheet instability indicate that such outcomes may be more likely than previously thought. To ensure consistency with these recent updates to the peer-reviewed scientific literature, we recommend a revised ‘extreme’ upper-bound scenario for GMSL rise of 2.5 m by the year 2100, which is 0.5 m higher than the upper bound scenario from Parris et al. (2012) employed by the Third NCA (NCA3). In addition, after consideration of tide gauge and altimeter-based estimates of the rates of GMSL change over the past quarter-century and of recent modeling of future low-end projections of GMSL rise, we revise Parris et al. (2012)’s estimate of the lower bound upward by 0.1 m to 0.3 m by the year 2100.
This report articulates the linkages between scenario-based and probabilistic projections of future sea levels for coastal-risk planning, management of long-lived critical infrastructure, mission readiness, and other purposes. The probabilistic projections discussed in this report recognize the inherent dependency (conditionality) of future GMSL rise on future greenhouse-gas emissions and associated ocean-atmosphere warming. In recognition of the different time horizons of relevance to different decision contexts, as well as the long-term GMSL rise commitment (lagged GMSL response) from on-going increases in ocean-atmosphere warming, GMSL rise and associated RSL change are quantified from the year 2000 through the year 2200 (on a decadal basis to 2100 and with lower temporal frequency between 2100 and 2200). The 0.3 m-2.5 m GMSL range for 2100 is discretized by 0.5-m increments and aligned with emissions based, conditional probabilistic storylines and global model projections into six GMSL rise scenarios: a Low, Intermediate-Low, Intermediate, Intermediate-High, High and Extreme, which correspond to GMSL rise of 0.3 m, 0.5 m, 1.0 m, 1.5 m, 2.0 m and 2.5 m, respectively. These GMSL rise scenarios are used to derive regional RSL responses on a 1-degree grid covering the coastlines of the U.S. mainland, Alaska, Hawaii, the Caribbean, and the Pacific island territories, as well as at the precise locations of tide gauges along these coastlines.
These scenario-based RSL values fill a major gap in climate information needed to vii support a wide range of assessment, planning, and decision-making processes. GMSL was adjusted to account for key factors important at regional scales, including: 1) shifts in oceanographic factors such as circulation patterns; 2) changes in the Earth’s gravitational field and rotation, and the flexure of the crust and upper mantle, due to melting of land-based ice; and 3) vertical land movement (VLM; subsidence or uplift) due to glacial isostatic adjustment (GIA, which also changes Earth’s gravitational field and rotation, as well as the overall shape of the ocean basin), sediment compaction, groundwater and fossil fuel withdrawals, and other non-climatic factors. Key findings include:
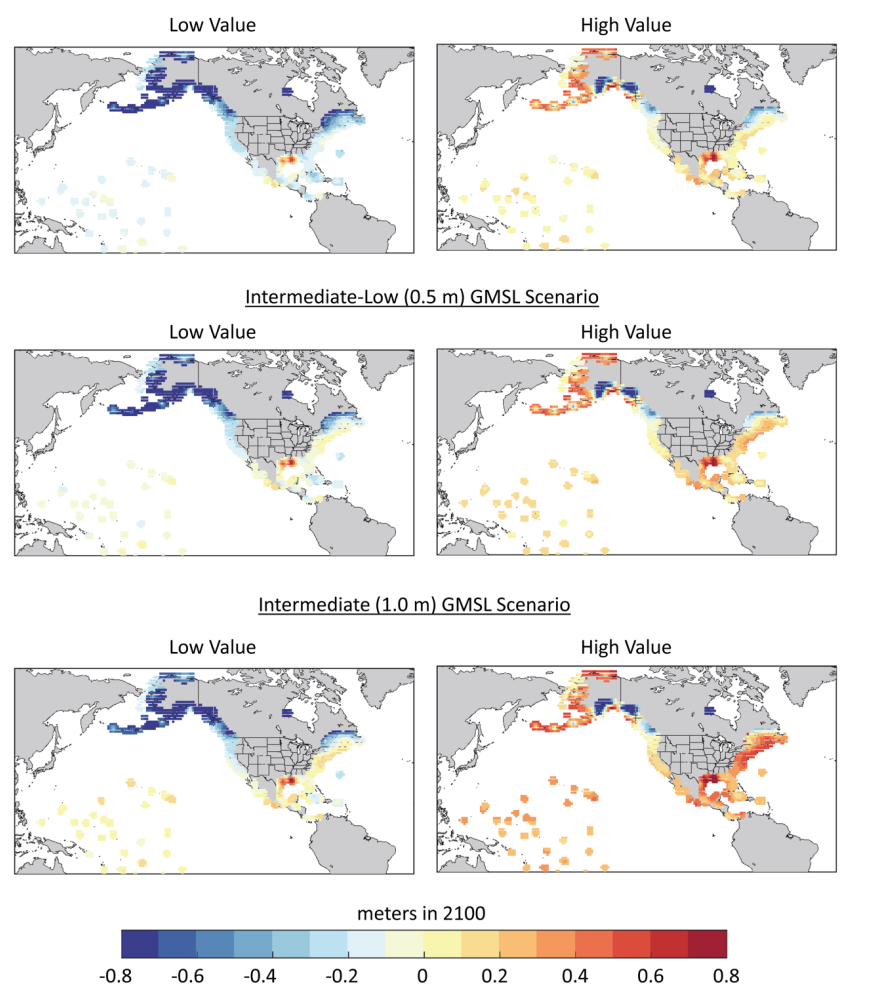
- Along regions of the Northeast Atlantic (Virginia coast and northward) and the western Gulf of Mexico coasts, RSL rise is projected to be greater than the global average for almost all future GMSL rise scenarios (e.g., 0.3-0.5 m or more RSL rise by the year 2100 than GMSL rise under the Intermediate scenario).
- Along much of the Pacific Northwest and Alaska coasts, RSL is projected to be less than the global average under the Low-to-Intermediate scenarios (e.g., 0.1-1 m or less RSL rise by the year 2100 than GMSL rise under the Intermediate scenario).
- Along almost all U.S. coasts outside Alaska, RSL is projected to be higher than the global average under the Intermediate-High, High and Extreme scenarios (e.g., 0.3-1 m or more RSL rise by the year 2100 than GMSL rise under the High scenario).
Finally, the consequences of rising RSL are presented in terms of how the frequency of moderate-level flooding associated with a NOAA coastal/lakeshore flood warning of a serious risk to life and property may change in the future under the sea level scenarios. The elevation threshold used to classify such events by NOAA on their tide gauges varies along the U.S. coastline, but in general it is about 0.8 m (2.6 feet) above the highest average tide and locally has a 20% annual chance of occurrence. For example, using the flood-frequency definition, we find at most locations examined (90 cities along the U.S. coastline outside of Alaska) that with only about 0.35 m (<14 inches) of local RSL rise, annual frequencies of such disruptive/damaging flooding will increase 25-fold by or about (+- 5 years) 2080, 2060, 2040 and 2030 under the Low, Intermediate-Low, Intermediate, Intermediate-High subset of scenarios, respectively.
techrpt83_Global_and_Regional_SLR_Scenarios_for_the_US_final (1)